General Dynamics (GD) Fundamental and Technical Stock Analysis: Can the Defence Prime Keep Outperforming?
$364.70
04 Mar 2026, 12:54
Neutral

Join Minipip Academy and access free courses in investing, trading, economics, and more.
Sign Up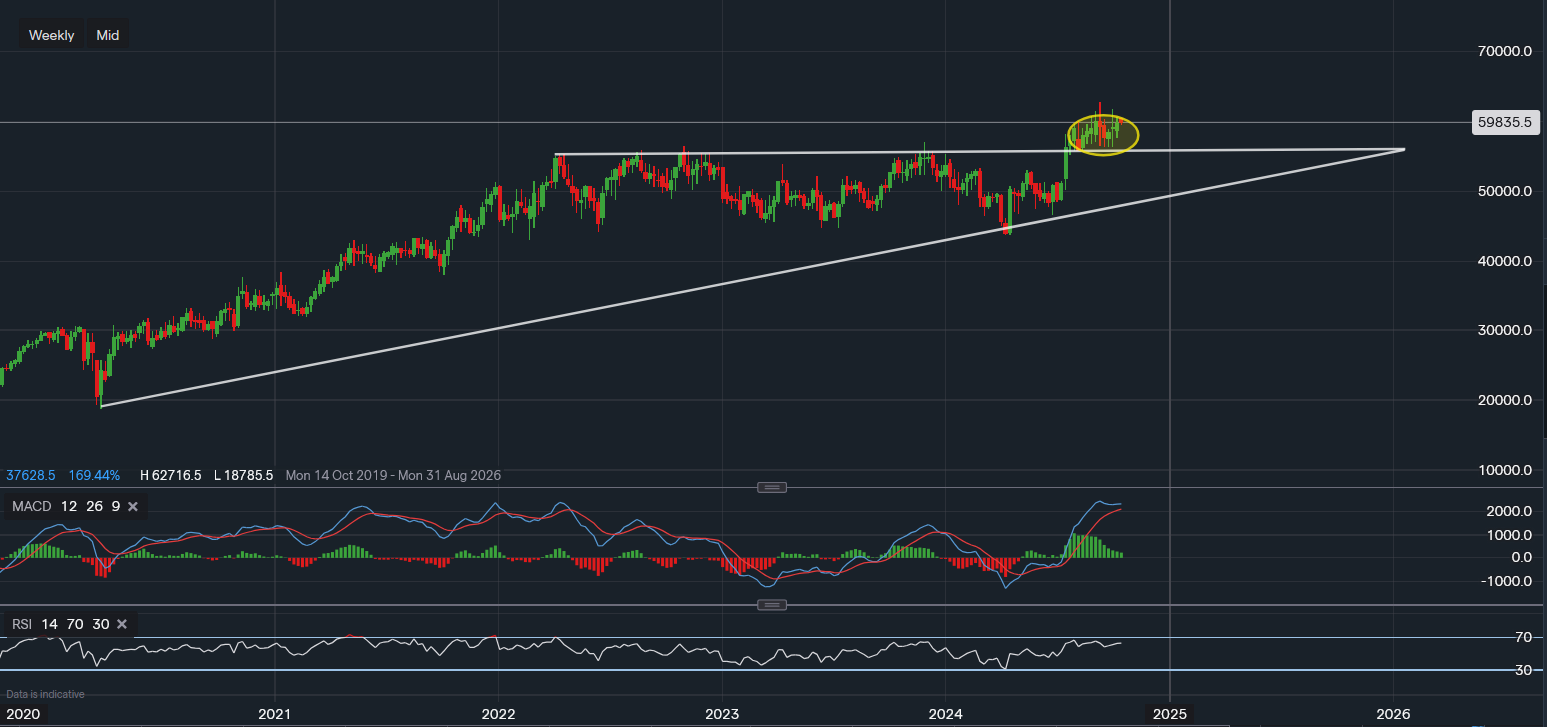
Chart & Data from IG
UnitedHealth is one of the first big firms from the healthcare sector set to report earnings tomorrow, looking at the weekly chart, we can see ever since its break higher the price has stalled. In hindsight, this was likely due to the stock adjusting itself ahead of the earnings as it searches for a catalyst to determine its direction. The price came close to testing the previous resistance level, which is now acting as support for the near term but has managed to remain above it. This usually is a positive sign as it indicates that buyers remain invested and the selling is having less impact than maybe when compared to other stocks. Its shares are trading at around $598.35 just 15 minutes ahead of the market open, it is likely that the price will close the session rather flat as everyone awaits the earnings outcome and guidance. Arguably, the resistance is around $627.16 after the overshoot, and there is no technical resistance beyond that point. If the price is to move above this level, investors may start focusing on psychological levels with $650 likely to become the first one. Unless we see a fall below the previous resistance point (currently support), a fall below $556 may lead to a pullback as low as the trendline support. Or respectively, around $500. Looking from the momentum-based perspective, it seems like the bullish outlook is still present. The MACD is still bullish, though it has stalled somewhat. However, the RSI is still rising as it reads 63.

Tradable assets:
Min.Deposit:
Max Leverage:
FCA:

Rating:


 Earnings Calendar
  Economic Calendar
  VAT Calculator
  Tax Free Childcare Calculator
 Percentage Calculator
 Compound Interest Calculator
  Loan Overpayment Calculator
 Mortgage Calculator
 Credit Card Calculator
 Investing
  Economics
 Trading
  Technical Analysis
  Personal Finance
 Calculator


