AbbVie (ABBV) Stock Analysis: Humira Decline, New Drug Growth, and Technical Consolidation
$228.47
06 Mar 2026, 17:58
Neutral

Join Minipip Academy and access free courses in investing, trading, economics, and more.
Sign Up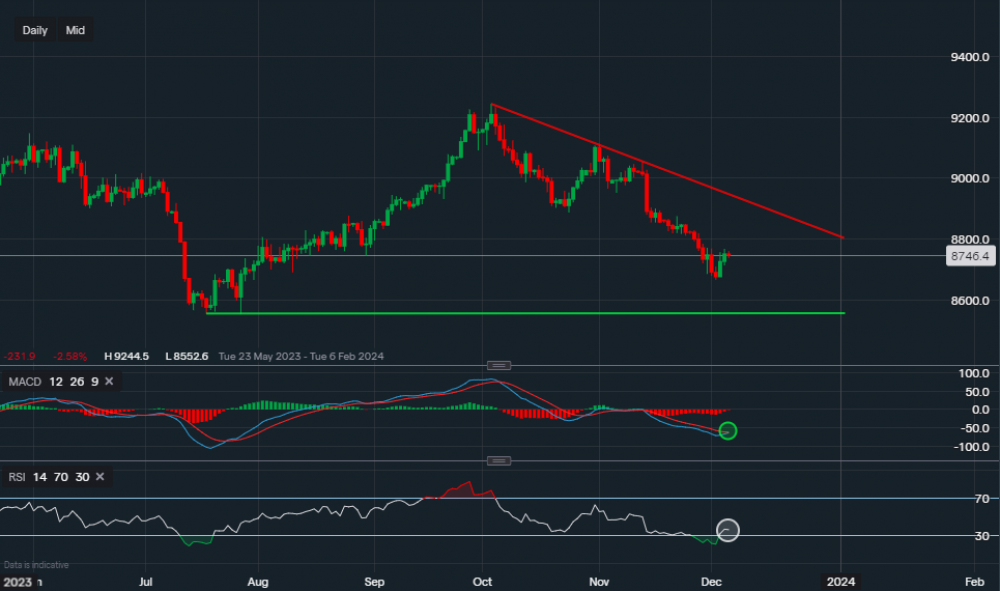
Chart & Data from IG
Taking a look at the USD/CHF forex pair. Currently, the US dollar is trading at around $0.8746 against the Swiss franc and we can see that the bearish trend, which began at the start of October, is still in play. Looking at the chart from a technical perspective based on a daily timeframe the key areas of support and resistance are highlighted by the trendlines. The base support sits at $0.8555 (green) and the tough resistance sits along the red trendline, ranging between $0.8859-$0.8893. A break below the support base could see this pair hit lows of the decade, whereas, a break above the resistance could spark a rally back up to the range of $0.91-$0.92. Glancing at the technical indicators, the MACD has been negative for some time now, especially throughout the November month. However, it seems like the volume is now flattening and the MACD line looks like it’s trying to move above its signal line. This would be a bullish indication. The RSI has also climbed out of the ‘oversold’ territory as it now reads 36. Although, it is still negative.

Tradable assets:
Min.Deposit:
Max Leverage:
FCA:

Rating:


 Earnings Calendar
  Economic Calendar
  VAT Calculator
  Tax Free Childcare Calculator
 Percentage Calculator
 Compound Interest Calculator
  Loan Overpayment Calculator
 Mortgage Calculator
 Credit Card Calculator
 Investing
  Economics
 Trading
  Technical Analysis
  Personal Finance
 Calculator


