General Dynamics (GD) Fundamental and Technical Stock Analysis: Can the Defence Prime Keep Outperforming?
$364.70
04 Mar 2026, 12:54
Neutral

Join Minipip Academy and access free courses in investing, trading, economics, and more.
Sign Up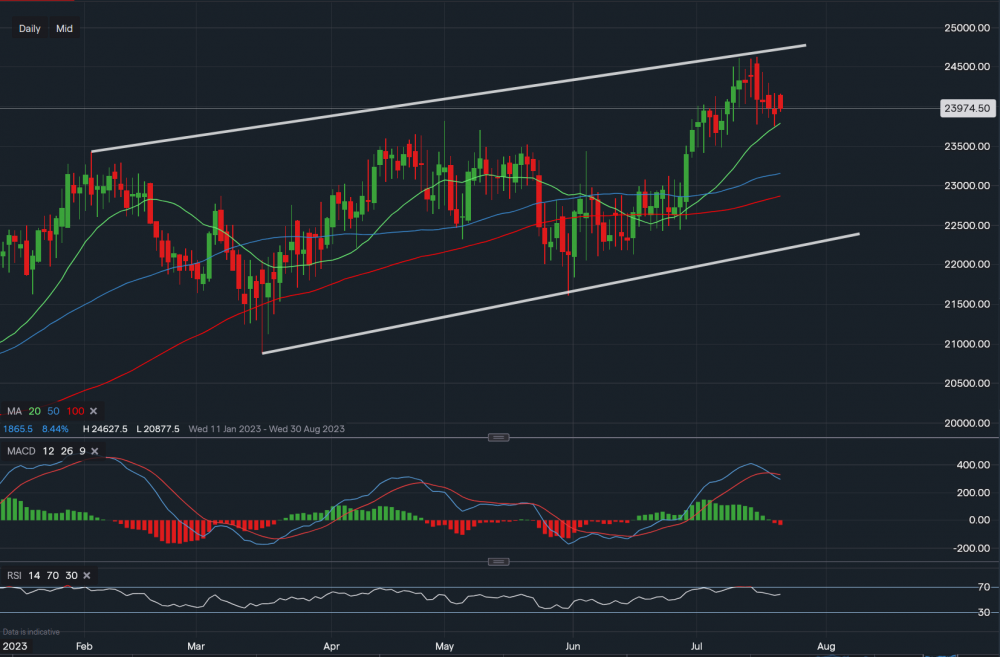
Chart & Data from IG
Taking a look at Visa as the company is due to report earnings tomorrow. It is expected to report earnings of $2.11 on revenue of $8.06bn. Currently, it is trading at around $239.74 a share, looking at the daily timeframe, we can see that the price has been rallying within the channel drawn on the chart. The price has created higher lows as well as higher highs, this is usually deemed as an indicator of a bullish trend. But looking at the stock for a shorter-term outlook, there was a support level test on Friday which tested the 20-day moving average ($237.35). It is now trading above it, however, if we see a move and close below it then we may see a further fall towards the 50-day MA ($231.53) and maybe even the 100-day MA ($228.68). Resistance now sits at $240.27 then at $241.27. A break above it would then allow us to look higher, with the target once again of $245 a share. Over to the technical indicators, MACD has turned negative but the RSI remains positive as it reads 58, suggesting a mixed view. There isn’t a clear view of direction which tends to happen prior to the earnings.


 Earnings Calendar
  Economic Calendar
  VAT Calculator
  Tax Free Childcare Calculator
 Percentage Calculator
 Compound Interest Calculator
  Loan Overpayment Calculator
 Mortgage Calculator
 Credit Card Calculator
 Investing
  Economics
 Trading
  Technical Analysis
  Personal Finance
 Calculator


