General Dynamics (GD) Fundamental and Technical Stock Analysis: Can the Defence Prime Keep Outperforming?
$364.70
04 Mar 2026, 12:54
Neutral

Join Minipip Academy and access free courses in investing, trading, economics, and more.
Sign Up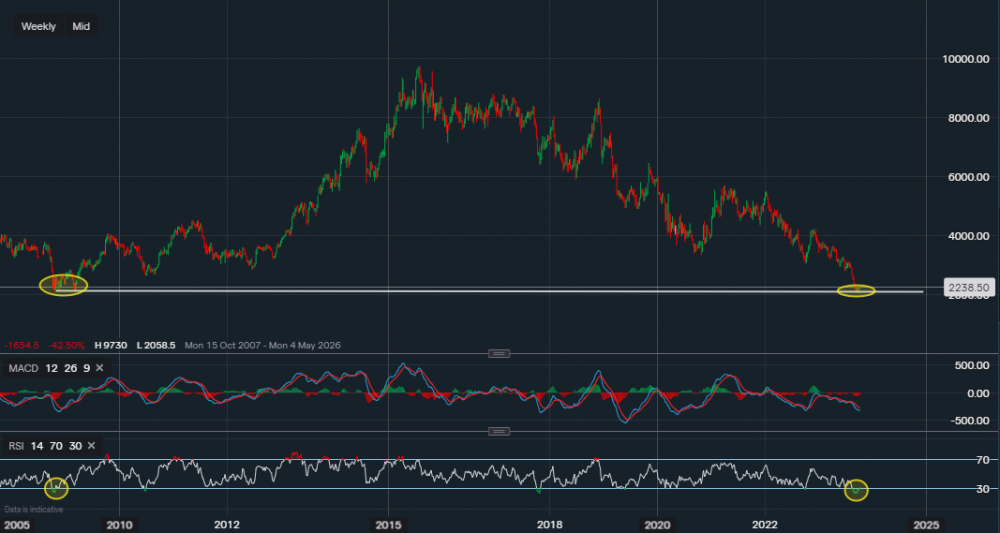
Chart & Data from IG
Taking a look at Walgreens Boots Alliance as the firm is scheduled to report earnings tomorrow. Currently, its stock is trading at $22.36 a share. We can see that since its peak in 2015, the price has been falling over the years. Now down 76% since 2015 and down 40% since the start of the year. Having said all that, we can also see that it is approaching a key support level which reads $21.28. This level is highlighted by the trendline which dates back to the lows of 2008. If we look deeper into the chart and glance over at the technical indicators, we can see that the RSI is oversold with a curling MACD. If we head back to 2008 the RSI was also oversold with a curling MACD, which led to a bounce higher in the following months. It is not guaranteed that history will repeat itself ever so slightly, but investors and traders search for such opportunities for short-term profits. Of course, a break below the support of $21.28 would indicate that more downside is likely. However, any signs of consolidation around current levels or the trendline may create a short-term opportunity. At present, the RSI reads 30, it’s trying to climb out of the oversold territory and the MACD is still negative.

Tradable assets:
Min.Deposit:
Max Leverage:
FCA:

Rating:


 Earnings Calendar
  Economic Calendar
  VAT Calculator
  Tax Free Childcare Calculator
 Percentage Calculator
 Compound Interest Calculator
  Loan Overpayment Calculator
 Mortgage Calculator
 Credit Card Calculator
 Investing
  Economics
 Trading
  Technical Analysis
  Personal Finance
 Calculator


