AbbVie (ABBV) Stock Analysis: Humira Decline, New Drug Growth, and Technical Consolidation
$228.47
06 Mar 2026, 17:58
Neutral

Join Minipip Academy and access free courses in investing, trading, economics, and more.
Sign Up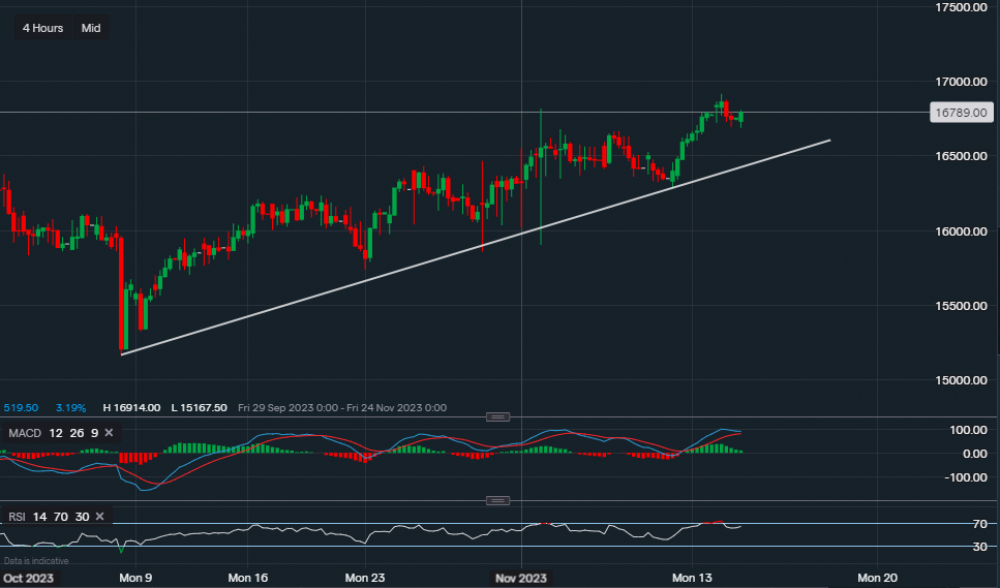
Chart & Data from IG
Taking a look at Walmart ahead of its quarterly earnings tomorrow. Looking at the 4-hourly chart, we can see that the price has maintained an upward trend along the supportive trendline. Currently, its share price is trading at around $167.89, it did reach an all-time high of $169.14 in yesterday’s session but has retraced a little since. The price volatility ahead of the upcoming earnings should be rather flat, with current support at $166.86 and the main resistance at $169.14. A dip below the support level, after the earnings, could see a further move lower towards the supportive trendline for yet another test. The trendline support reads $165.46. On the other hand, if we look towards the upside, a break and close above the resistance level could potentially see a rally beyond $170. Looking at the technical indicators, they continue to suggest a bullish bias. However, the MACD volume has lower and the MACD line has narrowed in with the signal line. The RSI remains positive, reading 64.

Tradable assets:
Min.Deposit:
Max Leverage:
FCA:

Rating:


 Earnings Calendar
  Economic Calendar
  VAT Calculator
  Tax Free Childcare Calculator
 Percentage Calculator
 Compound Interest Calculator
  Loan Overpayment Calculator
 Mortgage Calculator
 Credit Card Calculator
 Investing
  Economics
 Trading
  Technical Analysis
  Personal Finance
 Calculator


