AbbVie (ABBV) Stock Analysis: Humira Decline, New Drug Growth, and Technical Consolidation
$228.47
06 Mar 2026, 17:58
Neutral

Join Minipip Academy and access free courses in investing, trading, economics, and more.
Sign Up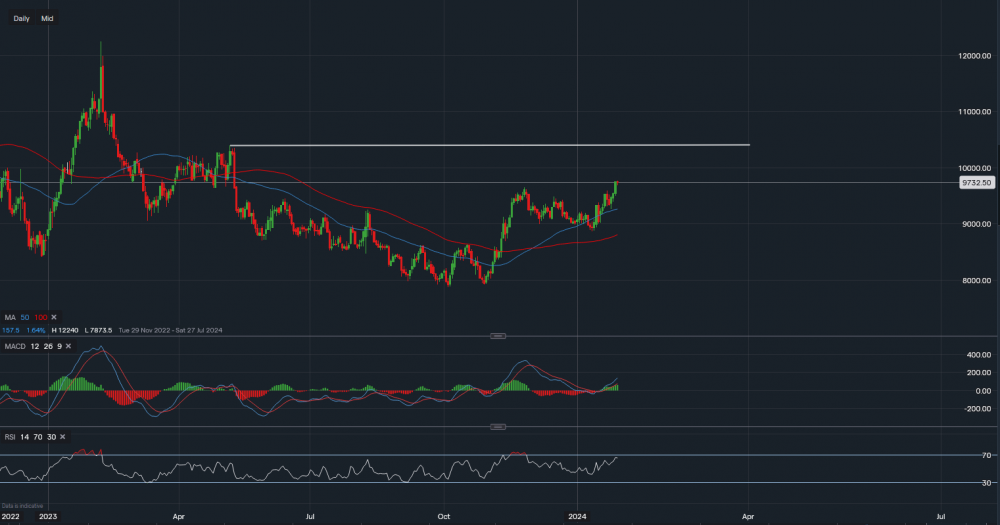
Chart & Data from IG
Taking a look at Disney as its share price broke through the resistance of $96.50 in yesterday’s session. The stock closed at $97.47 and is now trading at around $97.38 a share. Looking at the daily chart, we can see that back in October the price rallied to $96.50 after finding a bottom around $78-$79. The stock then saw some profit-taking along with a small retracement back to the 50-day moving average, the price did actually dip below the 50MA but managed to find support at $88.68. It now seems like another leg is underway with the next key resistance target sitting at $103.92 (white trendline). The support here now for Disney is at $96.41 then at $93.58 and then at $92.62. $92.62 currently correlates with the 50MA, hence, a pullback towards this level would be a vital test for the stock to uphold its recent bullish momentum. Looking at the technical indicators, the MACD is positive and rising, and the RSI is also positive as it reads 64.

Tradable assets:
Min.Deposit:
Max Leverage:
FCA:

Rating:


 Earnings Calendar
  Economic Calendar
  VAT Calculator
  Tax Free Childcare Calculator
 Percentage Calculator
 Compound Interest Calculator
  Loan Overpayment Calculator
 Mortgage Calculator
 Credit Card Calculator
 Investing
  Economics
 Trading
  Technical Analysis
  Personal Finance
 Calculator


