General Dynamics (GD) Fundamental and Technical Stock Analysis: Can the Defence Prime Keep Outperforming?
$364.70
04 Mar 2026, 12:54
Neutral

Join Minipip Academy and access free courses in investing, trading, economics, and more.
Sign Up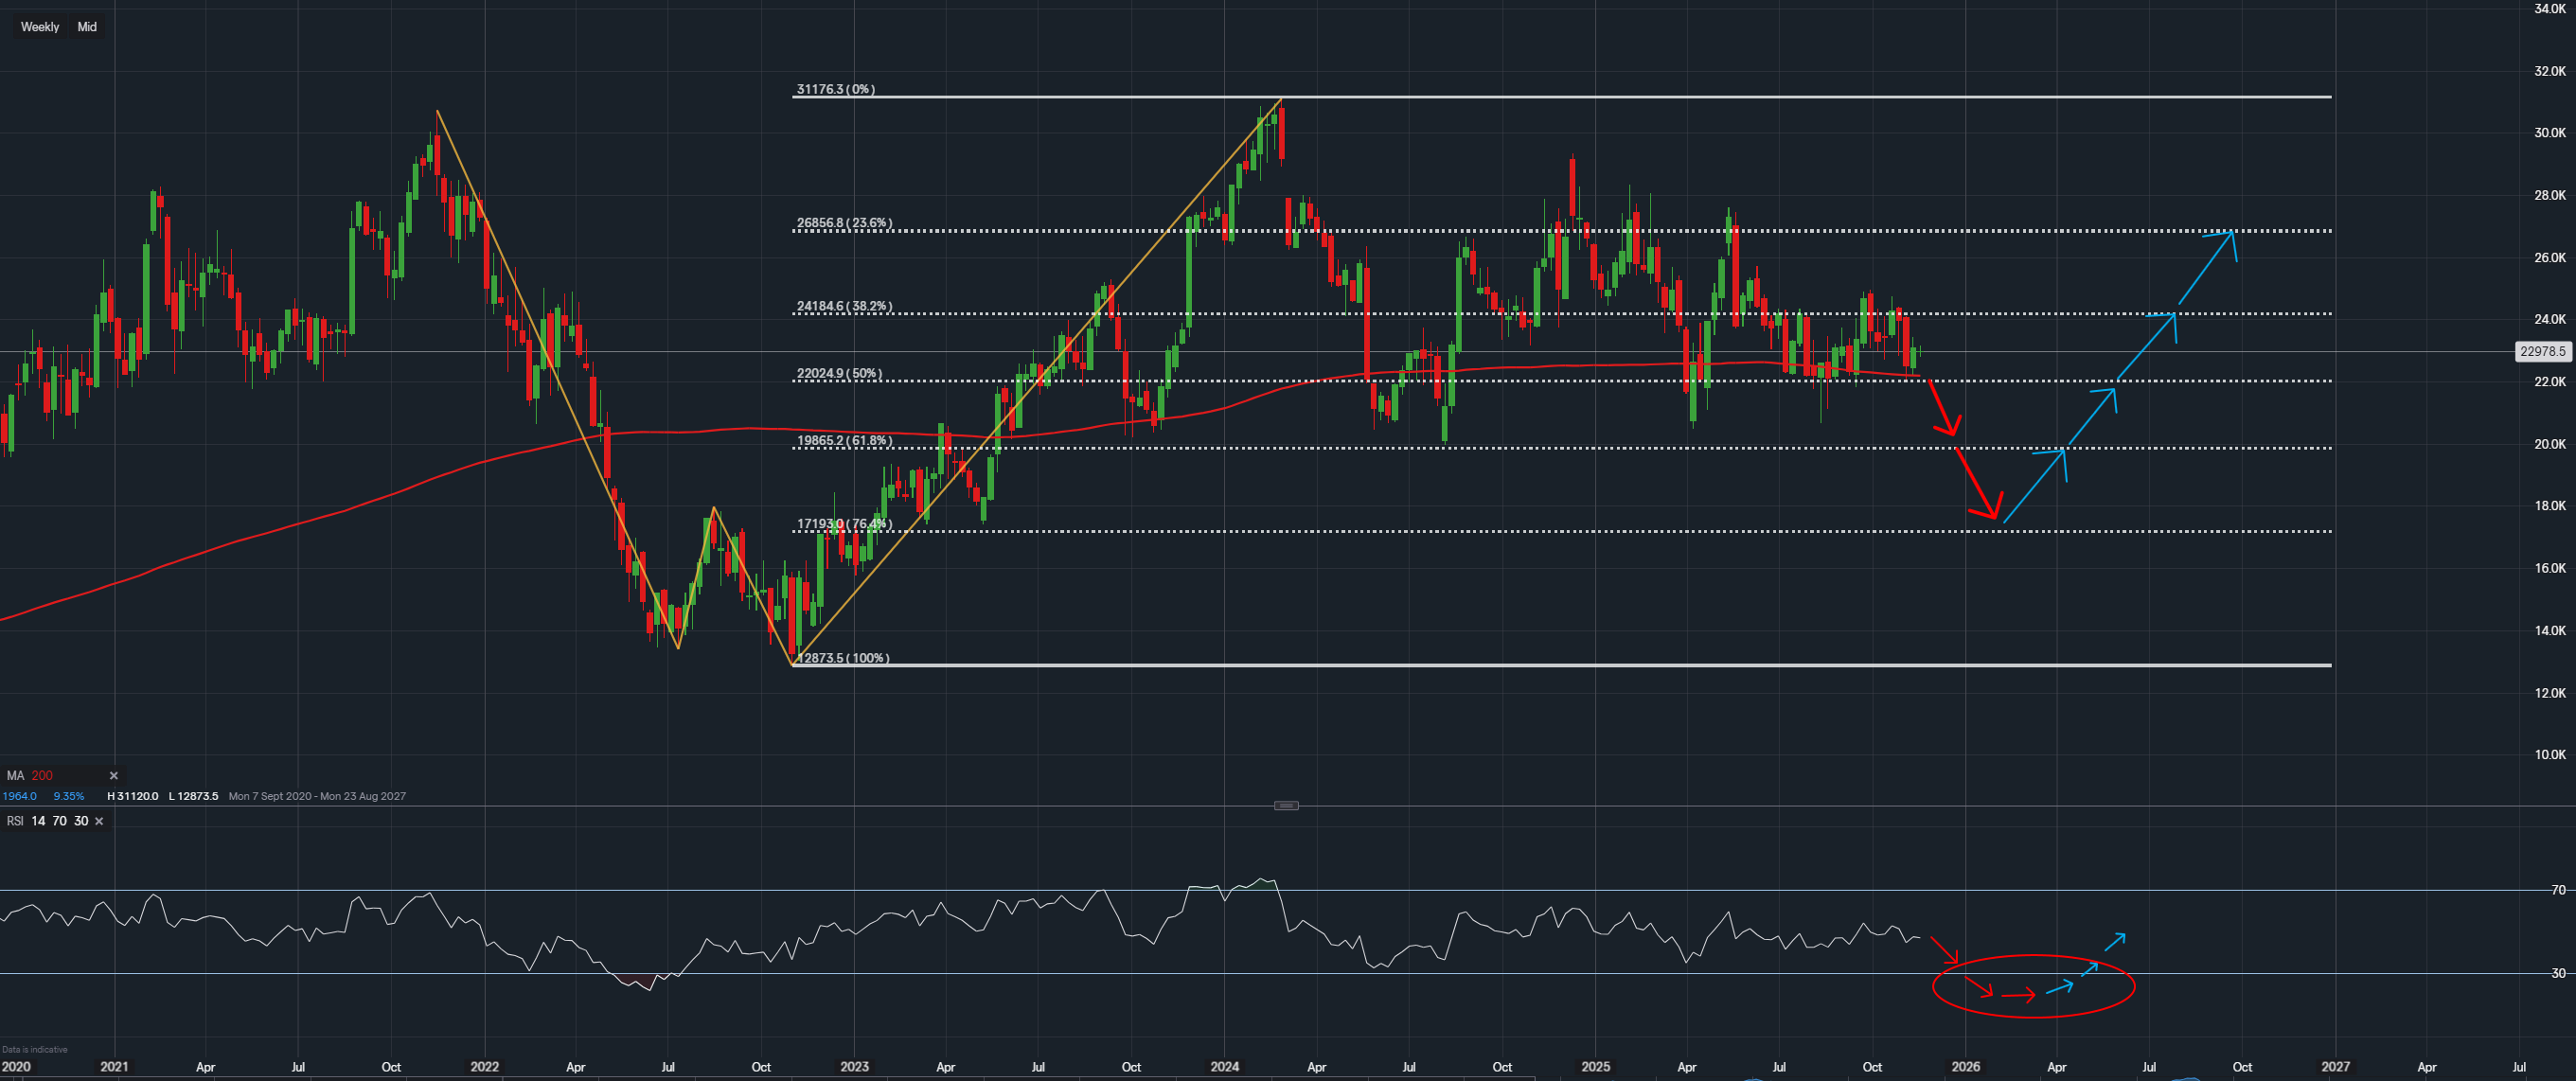
Data from IG - Timeframe - Weekly
Market Overview
Workday currently trades with a P/E ratio of 106.75, placing the stock firmly within the high-valuation category. Its forward P/E ratio of 21.78, however, shows expectations of stronger profitability over the coming 12 months, which provides some context for the premium the market is attaching to the company.
Analyst sentiment on TipRanks remains broadly positive, with 22 analysts supporting a Buy stance and 7 opting to Hold, reflecting general confidence in the company’s trajectory even though the stock sits on the more expensive side of the market.
Trend Structure and Key Levels
The chart displays a strong move to the upside followed by a wide and prolonged consolidation. Price has been oscillating between the Fibonacci retracement levels, which are currently acting as important reaction points. This multi-month range-bound behaviour often leads to a more decisive move later on, and Workday appears to be transitioning through this type of environment.
The 200-day moving average continues to cut through the mid-range of price action, acting as a balance point where price frequently returns before attempting any sustained direction. This reinforces the significance of the retracement levels as potential turning zones.
Potential Market Scenarios
Workday is currently positioned around a key support region within its Fibonacci retracement structure, and price behaviour here may shape the next phase of movement. If support begins to weaken, the pathway highlighted by the red arrows suggests the possibility of price drifting toward the deeper retracement levels. This would align with a continuation of the broader consolidation but with pressure shifting toward the lower boundary of the range, where sellers may attempt to assert more control.
On the other hand, if Workday manages to stabilise at this level, the blue arrows illustrate a potential rebound through the upper retracement zones. A recovery above the mid-range would hint at improving stability, and if higher lows start to form within this structure, it could point toward buyers gradually attempting to re-establish upward momentum. Such a development would bring the upper boundaries of the consolidation back into focus as possible areas of interest.
RSI Observations
The circled region on the RSI shows a period of downward momentum where the indicator is drifting toward oversold territory. If RSI continues to press lower, it may coincide with the bearish scenario and reflect ongoing fatigue within the current structure.
However, if RSI begins to turn upward as the blue arrow suggests it could signal an early momentum recovery. Such a shift would complement the bullish scenario, indicating improving strength and a potential willingness for price to revisit higher retracement levels.
Conclusion
Workday is currently moving within a well-defined Fibonacci retracement framework, creating both upper and lower regions of interest. With the stock sitting mid-range and showing signs of indecision, the next significant movement may come from how price behaves around its present support area.
These outlines simply reflect potential developments based on the structure visible on the chart, without acting as advice or suggesting any specific action from investors or traders.
Disclaimer:
This analysis is for informational purposes only and should not be considered financial advice. Investors and traders should conduct their own research and consider individual

Tradable assets:
Min.Deposit:
Max Leverage:
FCA:

Rating:


 Earnings Calendar
  Economic Calendar
  VAT Calculator
  Tax Free Childcare Calculator
 Percentage Calculator
 Compound Interest Calculator
  Loan Overpayment Calculator
 Mortgage Calculator
 Credit Card Calculator
 Investing
  Economics
 Trading
  Technical Analysis
  Personal Finance
 Calculator


