General Dynamics (GD) Fundamental and Technical Stock Analysis: Can the Defence Prime Keep Outperforming?
$364.70
04 Mar 2026, 12:54
Neutral

Join Minipip Academy and access free courses in investing, trading, economics, and more.
Sign Up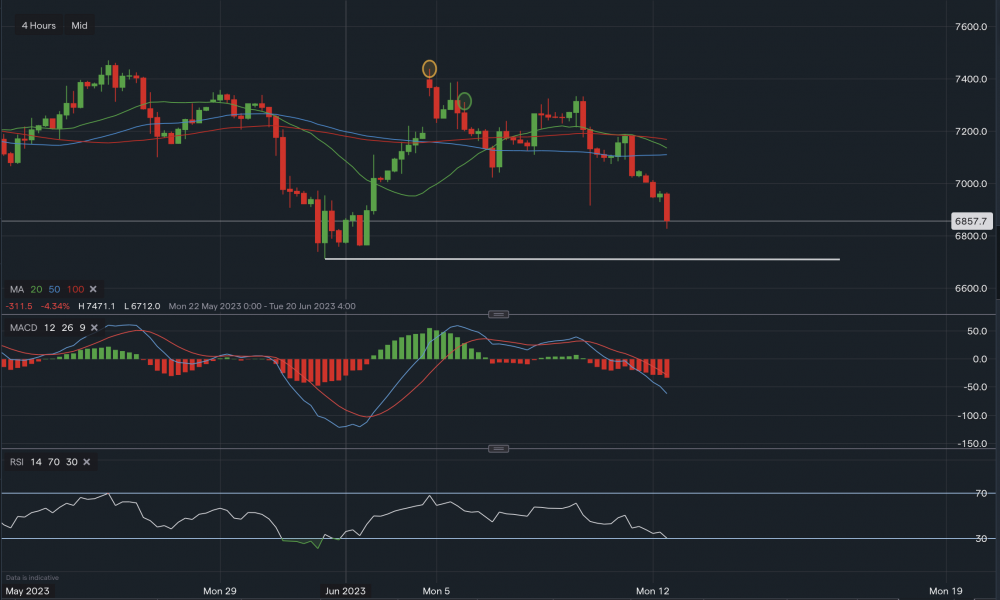
Chart & Data from IG
Taking a look at WTI crude oil as it has pierced through all the moving averages that were acting as support. Last week seemed like a set up was potentially forming for some upside towards $74-$75 a barrel, but all the gains have now been wiped. Currently, the commodity is trading at around $68.57 a barrel. Looking on the 4 hourly timeframe, we can see it is now sliding towards the key support of $67.12 (along the white trendline). A break and close below this trendline could see oil slide much lower towards the levels of $64-$65 a barrel. If there is any sort of consolidation along the supportive trendline, then we would be looking towards the upside again. However, at the moment the bias remains bearish. Looking at the technical indicators, MACD is strongly negative and so is the RSI as it now reads 27. RSI has just entered ‘oversold’ territory though.

Tradable assets:
Min.Deposit:
Max Leverage:
FCA:

Rating:


 Earnings Calendar
  Economic Calendar
  VAT Calculator
  Tax Free Childcare Calculator
 Percentage Calculator
 Compound Interest Calculator
  Loan Overpayment Calculator
 Mortgage Calculator
 Credit Card Calculator
 Investing
  Economics
 Trading
  Technical Analysis
  Personal Finance
 Calculator


