General Dynamics (GD) Fundamental and Technical Stock Analysis: Can the Defence Prime Keep Outperforming?
$364.70
04 Mar 2026, 12:54
Neutral

Join Minipip Academy and access free courses in investing, trading, economics, and more.
Sign Up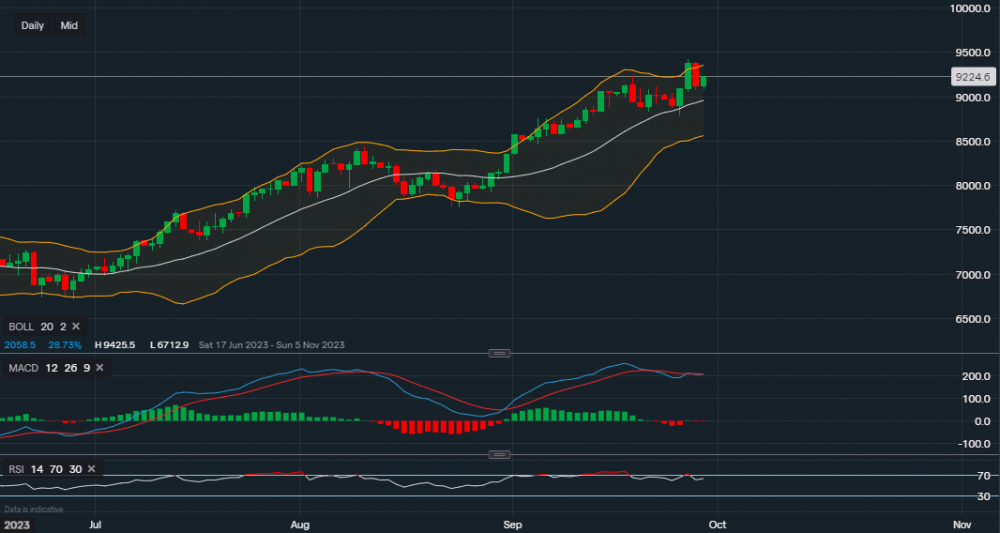
Chart & Data from IG
Crude oil continues to rise, reaching the high of the year on Wednesday of $94.25. Yesterday saw minor profit-taking, also boosted by the comments from Fed chair Jerome Powell. The commodity is now trading at $92.24​ a barrel and remains comfortably in the bull trend for now as highlighted by applying the Bollinger Bands to the chart. A rejection along the upper band occurred yesterday, but oil is now again up 1.4% on the day. Support sits at $90.71 and then $90.48, a break below $90.48 could see a slide towards $89.58 which is the middle moving average of the Bollingers. A move below the moving average would face support at $87.84 and possibly an extension to the lower band which currently reads $85.60. Towards the upside, a break above the high of $94.25 could potentially see oil head towards the range of $96-$97 a barrel. Even though the bias and momentum continue to suggest a bullish direction, the technical indicators are a little mixed as the MACD is now flat. But the RSI is still positive as it reads 63.

Tradable assets:
Min.Deposit:
Max Leverage:
FCA:

Rating:


 Earnings Calendar
  Economic Calendar
  VAT Calculator
  Tax Free Childcare Calculator
 Percentage Calculator
 Compound Interest Calculator
  Loan Overpayment Calculator
 Mortgage Calculator
 Credit Card Calculator
 Investing
  Economics
 Trading
  Technical Analysis
  Personal Finance
 Calculator


