General Dynamics (GD) Fundamental and Technical Stock Analysis: Can the Defence Prime Keep Outperforming?
$364.70
04 Mar 2026, 12:54
Neutral

Join Minipip Academy and access free courses in investing, trading, economics, and more.
Sign Up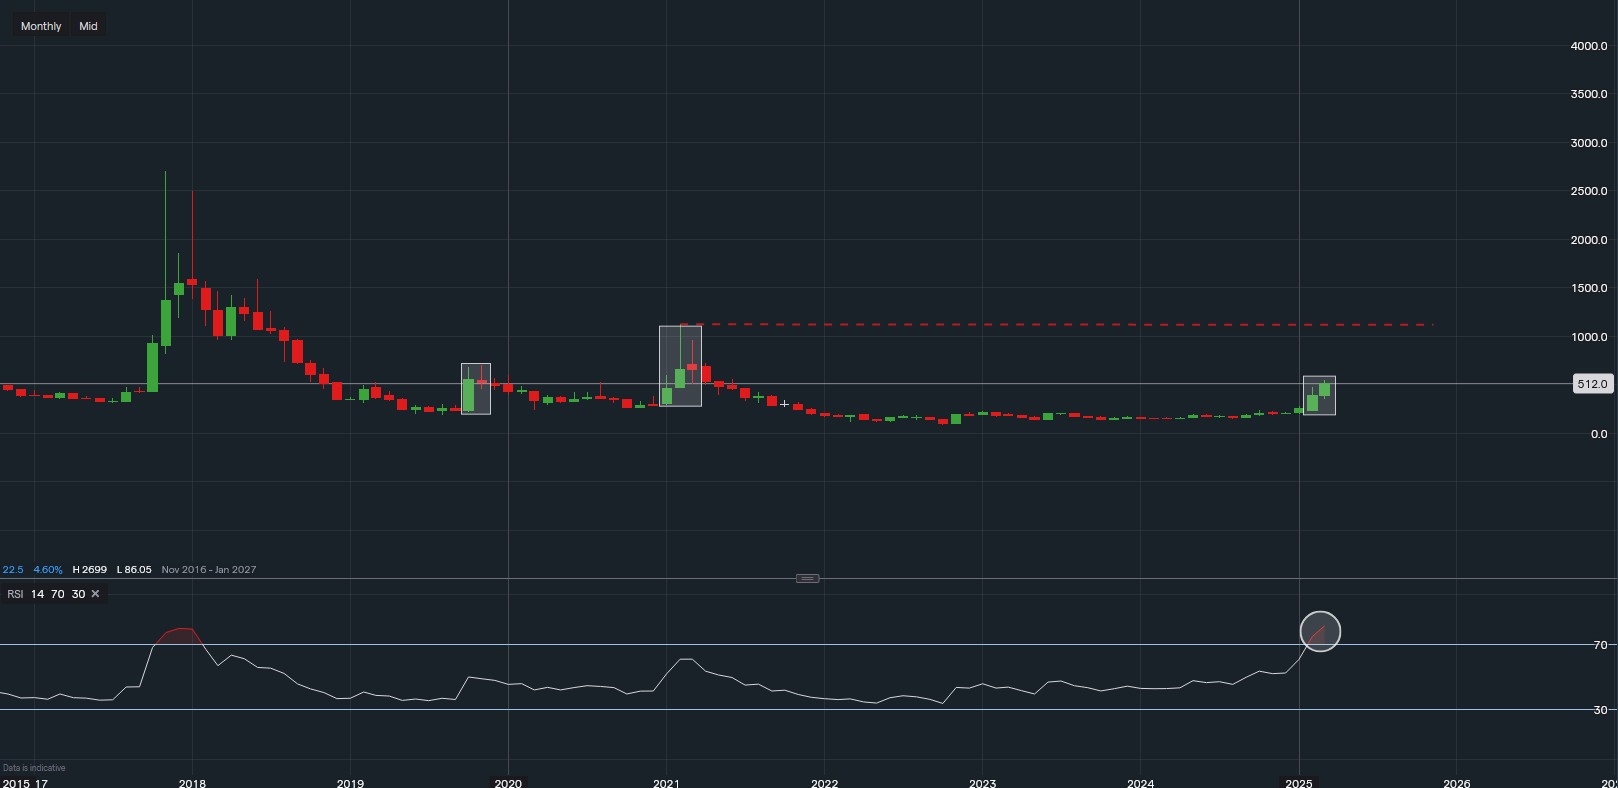
Chart & Data from IG
Xunlei Limited (NASDAQ: XNET) is a Chinese technology company specialising in distributed cloud services, offering products across cloud acceleration, blockchain, shared cloud computing, and digital entertainment.
Recent Financial Performance
As of the fiscal year ending December 31, 2023, Xunlei reported total revenue of $363.72 million, marking a 6.5% increase from the previous year. Gross profit for the same period was $163.07 million, up from $141.44 million in 2022. The company's net income stood at $14.22 million, a decrease from $21.46 million in the prior year.
Key Financial Metrics
Earnings Per Share (EPS): $0.23 over the last 12 months.
Price-to-Earnings (P/E) Ratio: 22.30, lower than the Computer and Technology sector average of 41.36, suggesting a more favourable valuation relative to peers.
Price-to-Book (P/B) Ratio: 1.04, indicating the stock is trading close to its book value.
Stock Performance
Over the past year, Xunlei's stock has experienced significant volatility, with a 52-week range between $1.28 and $2.09. As of December 30, 2024, the stock was trading at $2.14, reflecting a 25.49% increase over the year.
Liquidity and Financial Health
The company maintains a strong liquidity position with $272.03 million in cash and cash equivalents and total debt of $14.64 million, resulting in a net cash position of $257.40 million, or $4.06 per share.
Xunlei Ltd. (NASDAQ: XNET) has been making headlines, currently trading at approximately $5.12 per share—a staggering 147% gain since the start of the year. But the key question remains: Can this momentum sustain, or is a pullback imminent?
A look at Xunlei’s price history reveals a recurring pattern: when the stock surges sharply at the beginning of the year, it tends to decline for the remainder of the year. This has occurred multiple times, suggesting that investors should proceed with caution.
One major indicator to watch is the Relative Strength Index (RSI) on the monthly chart, which now suggests strong overbought conditions. This could trigger profit-taking, leading to potential short-term pullbacks.
Despite its recent gains, the risk-to-reward ratio is not currently favourable. Overbought conditions and historical trends suggest that investors should exercise caution and watch for potential pullbacks or consolidation before considering new positions.
Conclusion
Xunlei Limited demonstrates steady revenue growth and maintains a strong liquidity position. However, the decline in net income and limited analyst coverage suggest a cautious approach. Potential investors should consider these factors alongside the company's market position and future growth prospects.

Tradable assets:
Min.Deposit:
Max Leverage:
FCA:

Rating:


 Earnings Calendar
  Economic Calendar
  VAT Calculator
  Tax Free Childcare Calculator
 Percentage Calculator
 Compound Interest Calculator
  Loan Overpayment Calculator
 Mortgage Calculator
 Credit Card Calculator
 Investing
  Economics
 Trading
  Technical Analysis
  Personal Finance
 Calculator


