Visa Stock Analysis: Is Visa a Strong Opportunity Ahead of Q4 Earnings?
$325.48
28 Jan 2026, 19:25
Bullish
Data from IG - Timeframe - 4H
Market Overview
Agilent Technologies continues to attract attention across the healthcare and life science investment landscape, supported by both its financial positioning and a constructive market sentiment profile. The company’s present P/E ratio of 33.77, compared with a significantly lower forward P/E of 23.59, reflects expectations of meaningful earnings growth over the next year. This valuation softening suggests that analysts anticipate an improvement in profitability, allowing investors to maintain exposure to a sector known for its resilience while still seeking long-term value. This broader optimism is echoed by TipRanks analysts, where the consensus leans toward further upside, with only a small minority remaining cautious as they assess longer-term positioning.
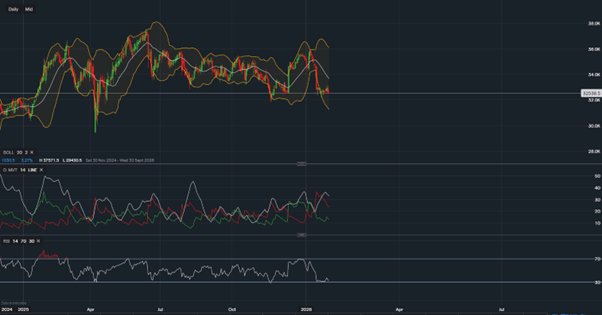
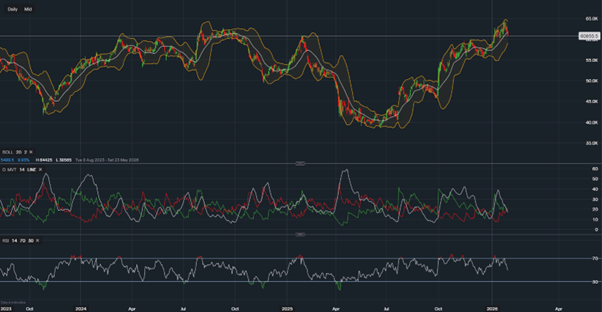
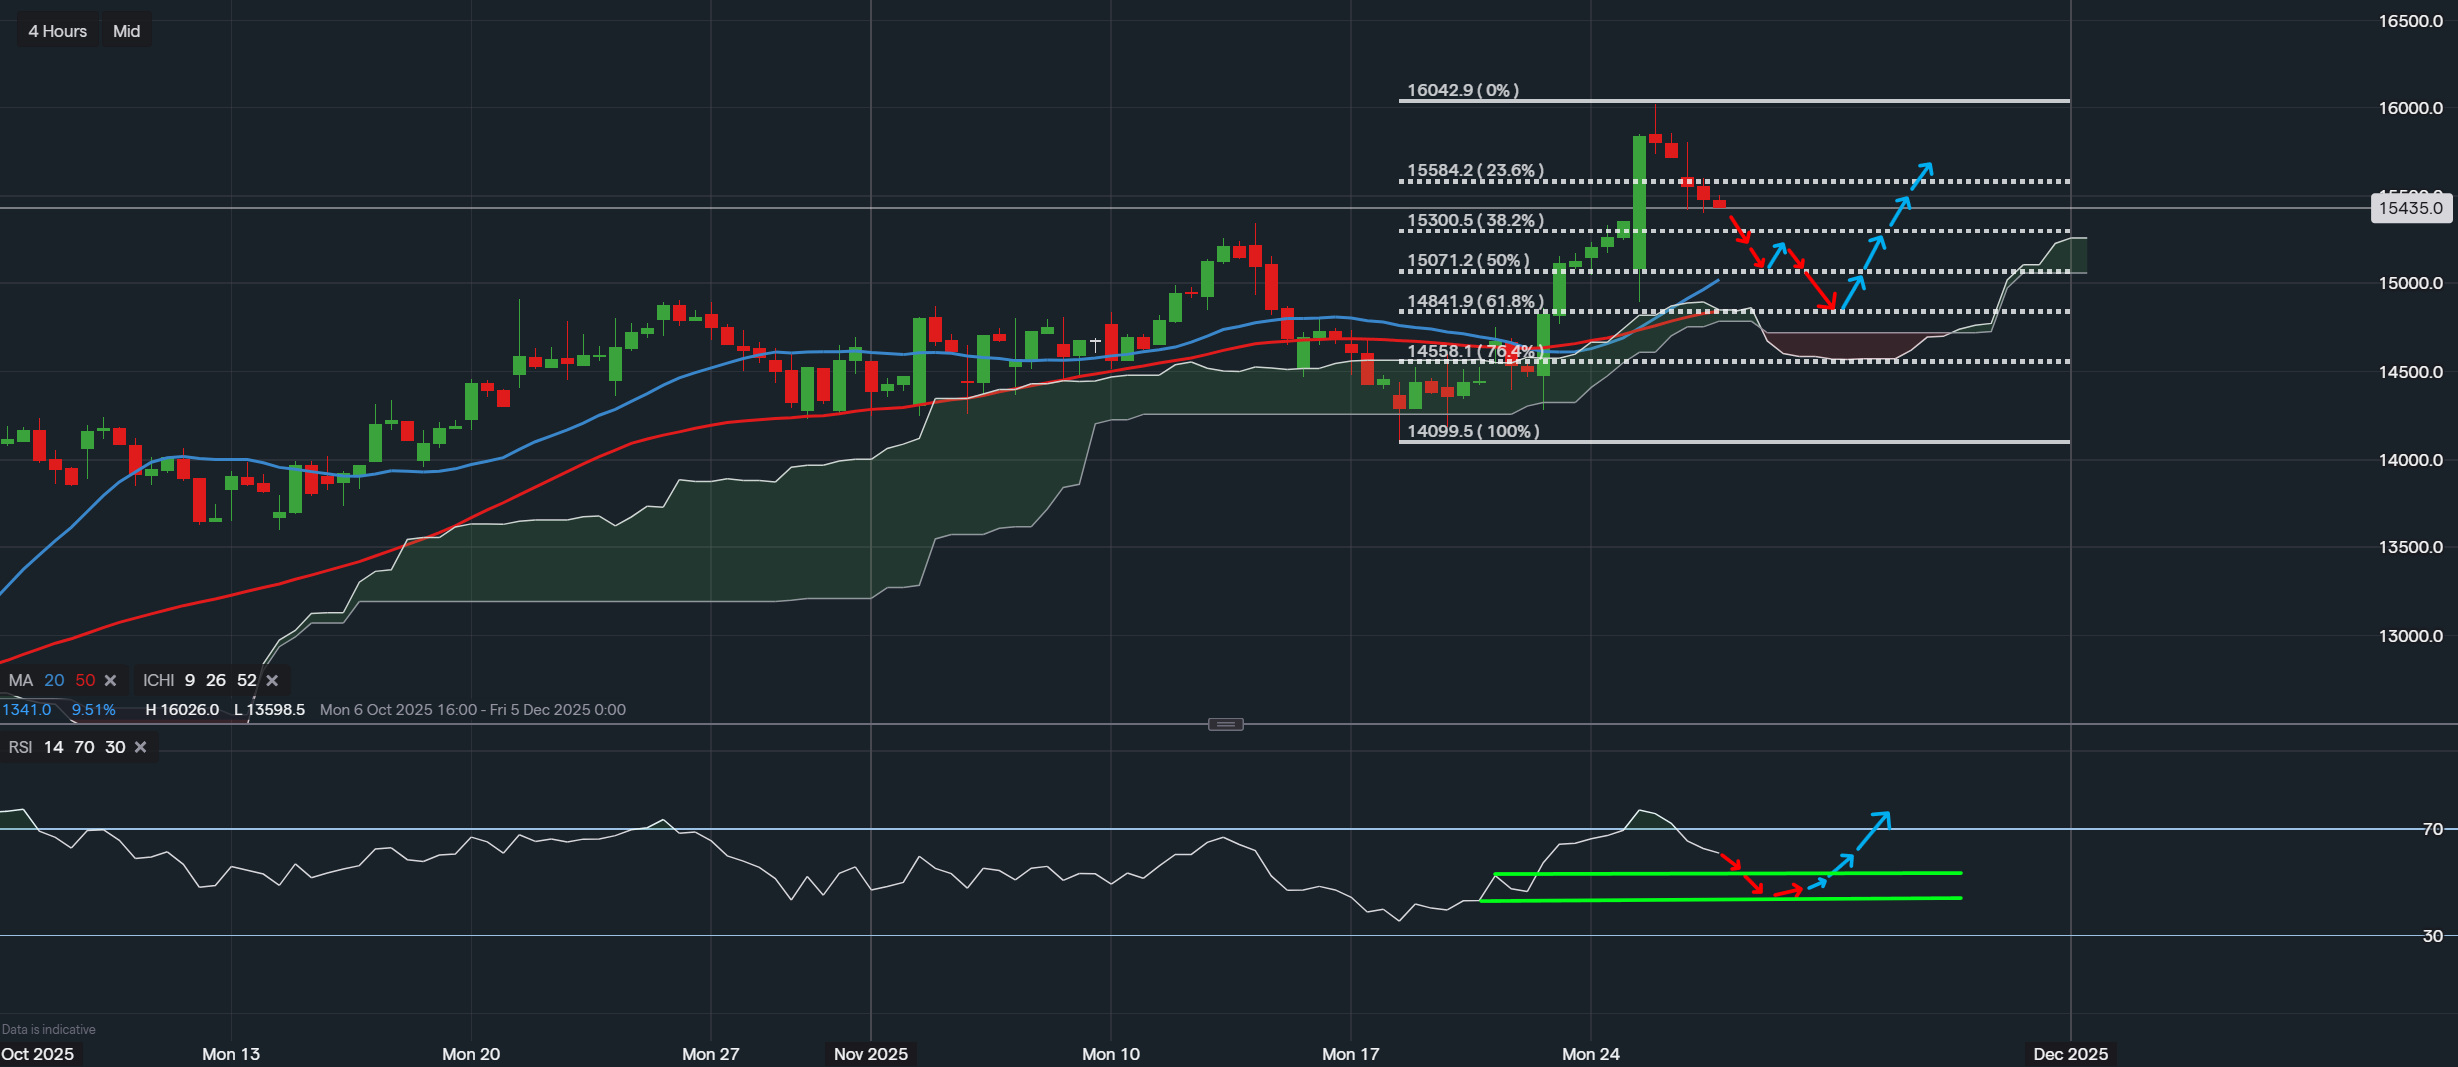
Fibonacci Levels Shaping Short-Term Direction
From a technical perspective, Agilent’s price behaviour is currently navigating a dynamic but potentially constructive phase. Using the Fibonacci retracement structure drawn from its recent swing high to swing low, the share price appears to be interacting with key intermediate levels. The 38.2% and 50% retracement zones are functioning as the main pivot regions, and the recent consolidation around these levels may indicate a market preparing for its next directional move. Should Agilent maintain stability above the 50% region, it would signal healthy buying interest, while a dip into the 61.8% level could represent a deeper but still technically normal retracement within a broader upward cycle.
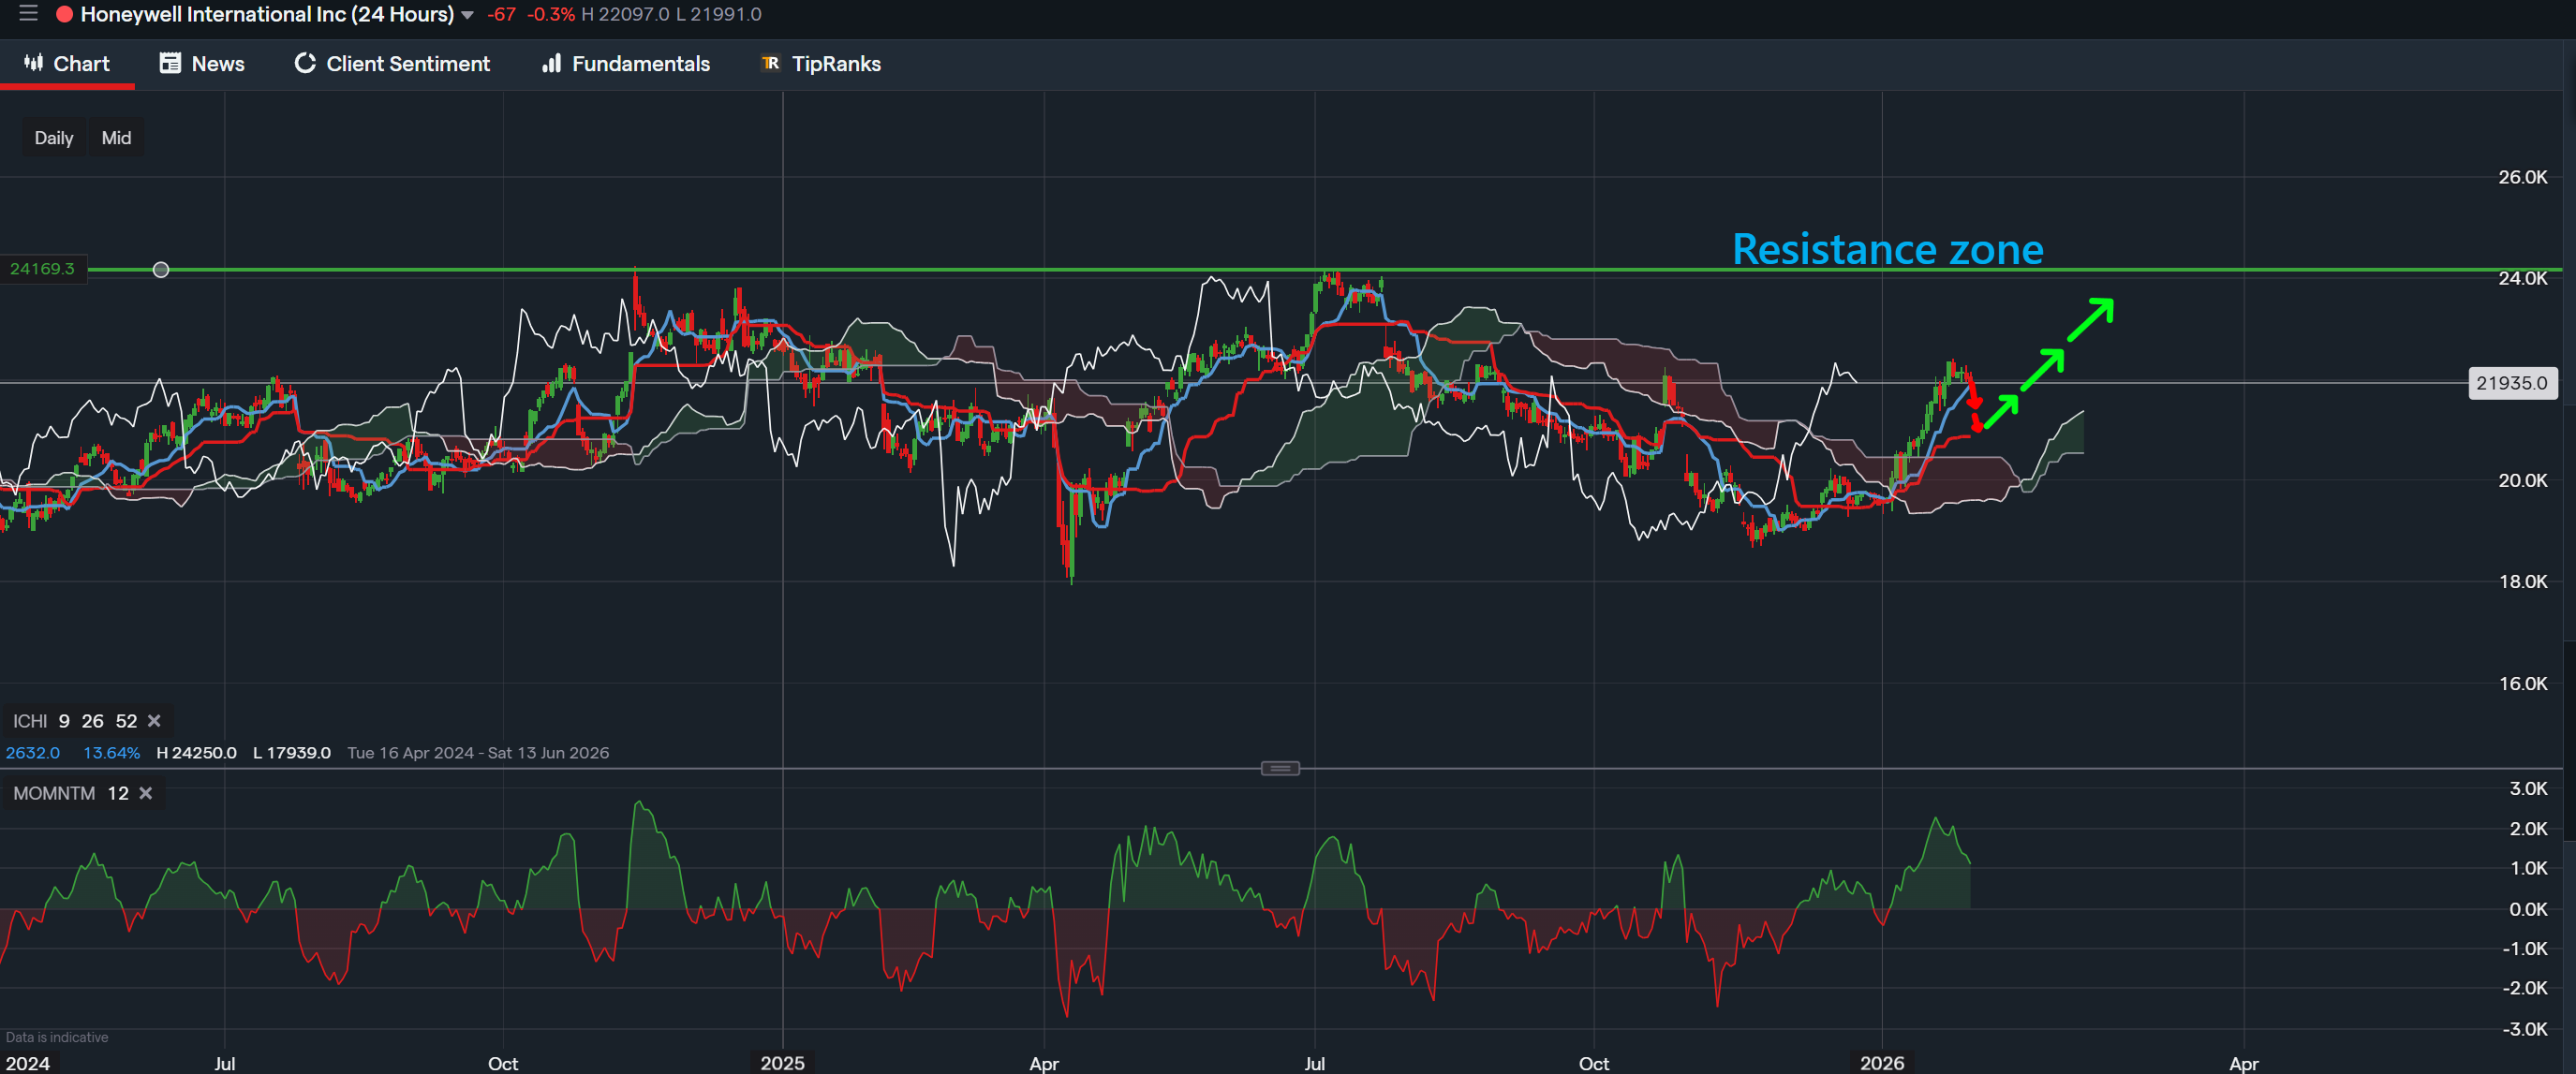
Ichimoku Cloud Highlighting Trend Transition
Overlaying the Ichimoku Kumo Cloud adds further insight into the underlying trend bias. The price action is currently positioned near the upper edge of the cloud, suggesting a transition phase where the market is attempting to reclaim bullish structure after a period of uncertainty. A clean break and sustained movement above the cloud would reflect renewed momentum, whereas a drift back into the cloud would highlight indecision and potentially extend the consolidation phase. The thickness of the Kumo offers a useful gauge of market equilibrium, with Agilent hovering around an area that could act as a stabilising cushion should sellers attempt to push the price lower.
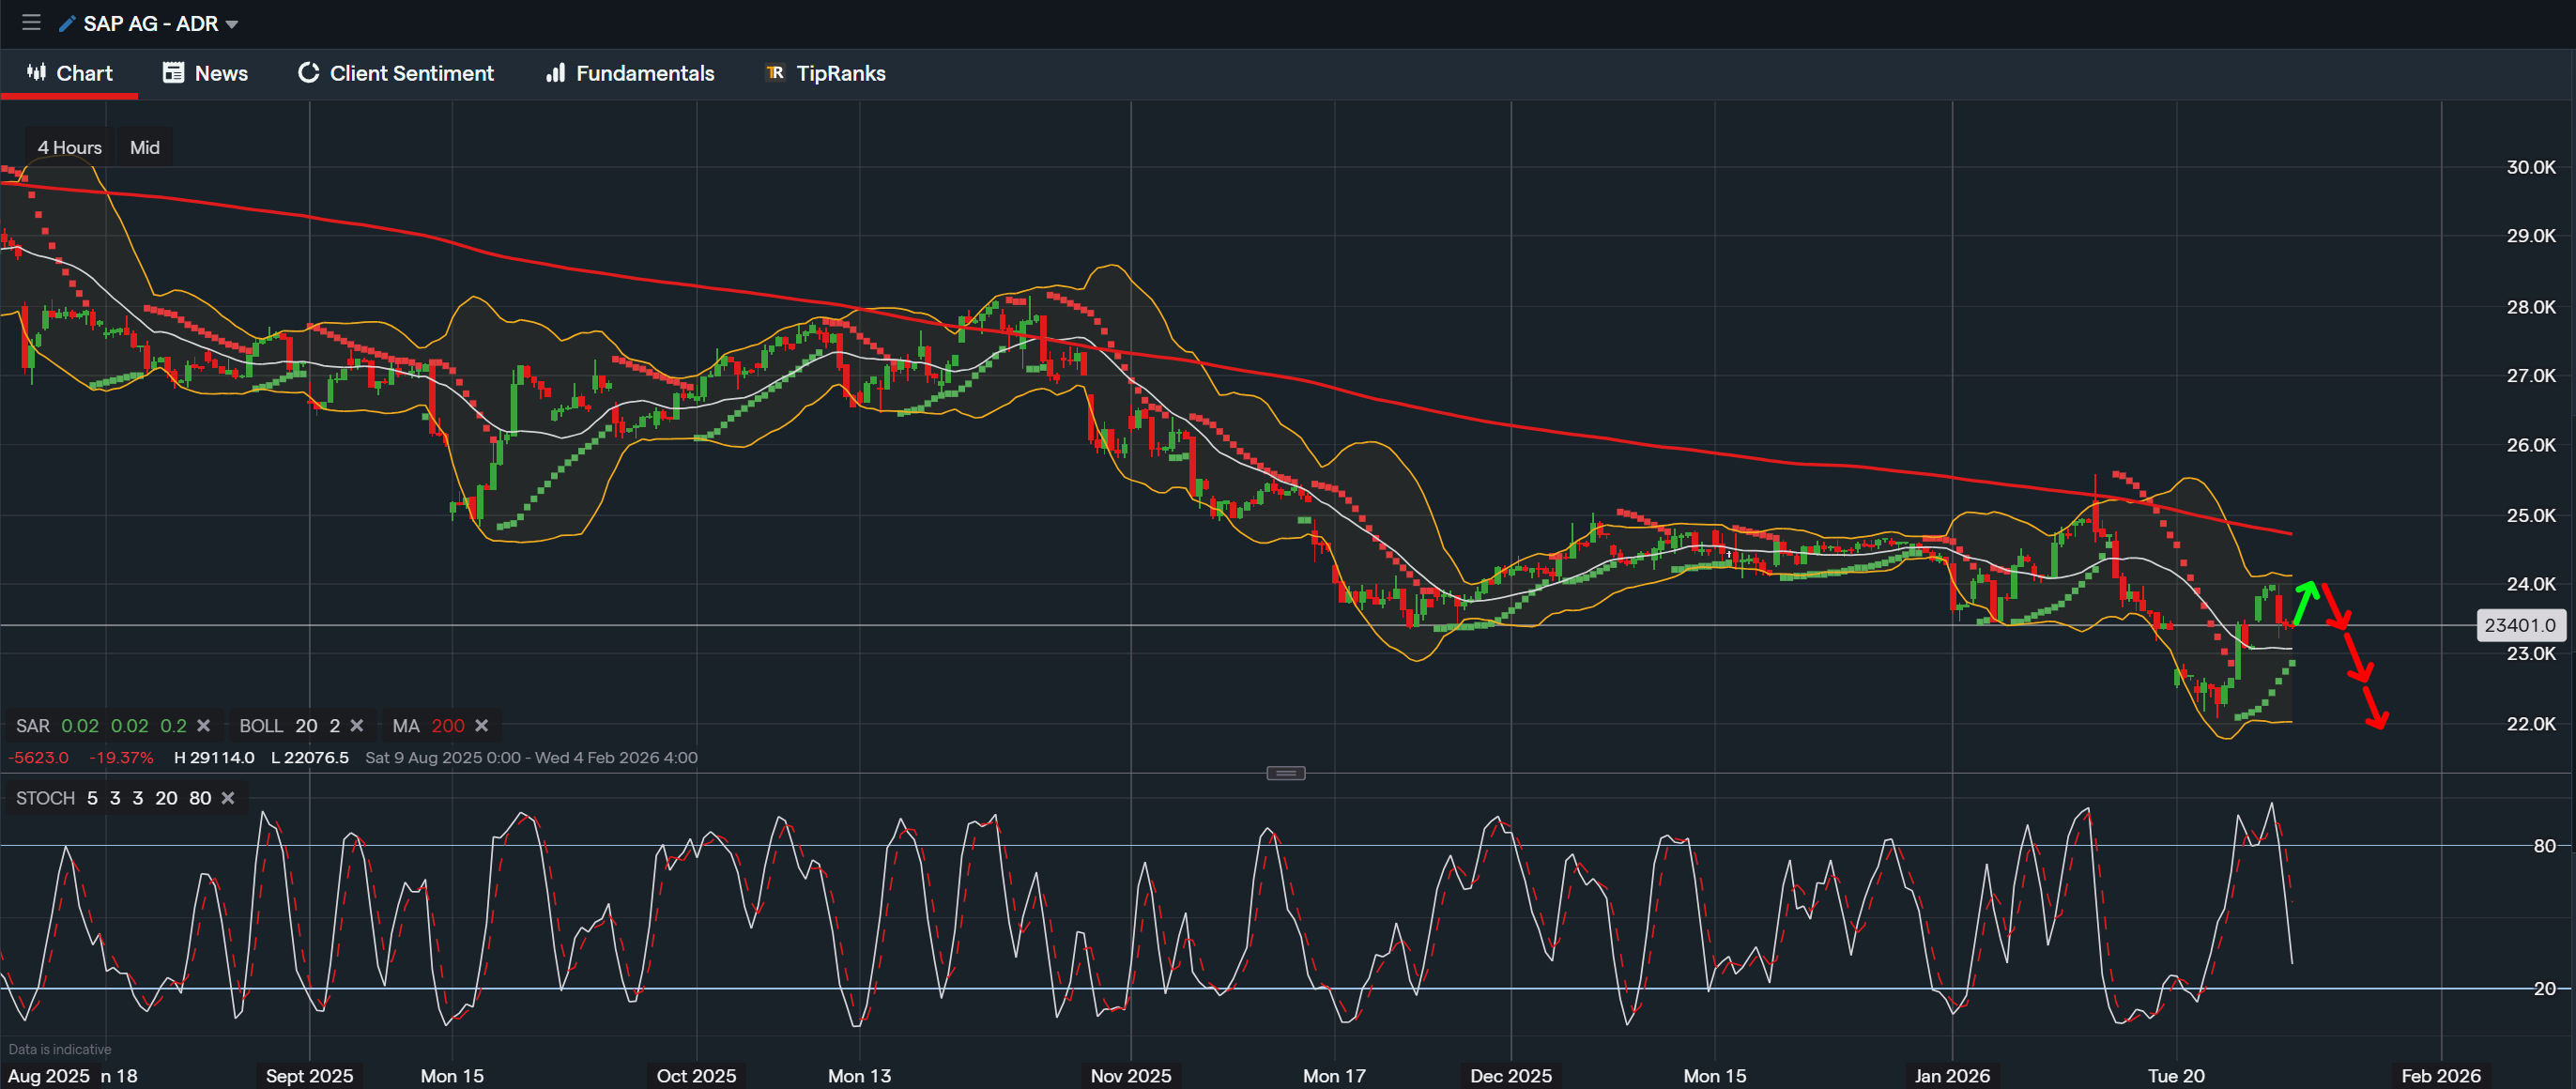
Moving Averages Signalling Market Balance
The moving averages, particularly the 20 day and 50 day lines, provide additional confirmation. The 20 day average has begun to flatten after a previous decline, while the 50 day remains positioned as a longer term guide to trend direction. A decisive reclaim of the 20 day would suggest that buyers are regaining short-term control, and a subsequent cross above the 50 day could support a more sustained recovery attempt. Conversely, if the price were to fall below both moving averages, traders may read this as a sign that a more prolonged pullback is taking shape within the broader market structure.
RSI Momentum Offering Neutral Opportunity Zone
Momentum readings from the RSI add another layer to the story. The indicator is currently fluctuating in the mid-range, which generally reflects a market neither overstretched nor exhausted. This neutral positioning often precedes larger moves, as it signals that momentum has room to build in either direction. Traders will likely pay close attention to whether the RSI holds above its recent support band, as this would align with the possibility of renewed bullish drive. A break below that level, however, could hint at weakening sentiment and raise the probability of price revisiting the lower Fibonacci zones.
Conclusion
Agilent’s technical landscape presents a balanced but intriguing picture for both investors and active traders. The company’s fundamental valuations point towards potential earnings improvements, while the chart structure shows a market currently engaged in a healthy retracement within a larger trend. The interplay between the Fibonacci retracement levels, the Ichimoku Cloud, moving averages, and RSI highlights a stock at an inflection point, where future movements will likely be shaped by how the price behaves around these key areas. While no outcome is guaranteed, the evidence suggests that Agilent may be positioning itself for a potential recovery phase if market conditions remain supportive. Traders watching for breakout signals and investors focused on longer term sector strength may find the coming sessions particularly significant as the stock tests the durability of its technical and fundamental foundations.
Disclaimer
This analysis is for informational purposes only and should not be considered financial advice. Investors and traders should conduct their own research and consider individual risk tolerance before making any investment decisions.

Tradable assets:
Min.Deposit:
Max Leverage:
FCA:

Rating:


 Earnings Calendar
  Economic Calendar
  VAT Calculator
  Tax Free Childcare Calculator
 Percentage Calculator
 Compound Interest Calculator
  Loan Overpayment Calculator
 Mortgage Calculator
 Credit Card Calculator