Visa Stock Analysis: Is Visa a Strong Opportunity Ahead of Q4 Earnings?
$325.48
28 Jan 2026, 19:25
Bullish
Data from IG - Timeframe - 4H
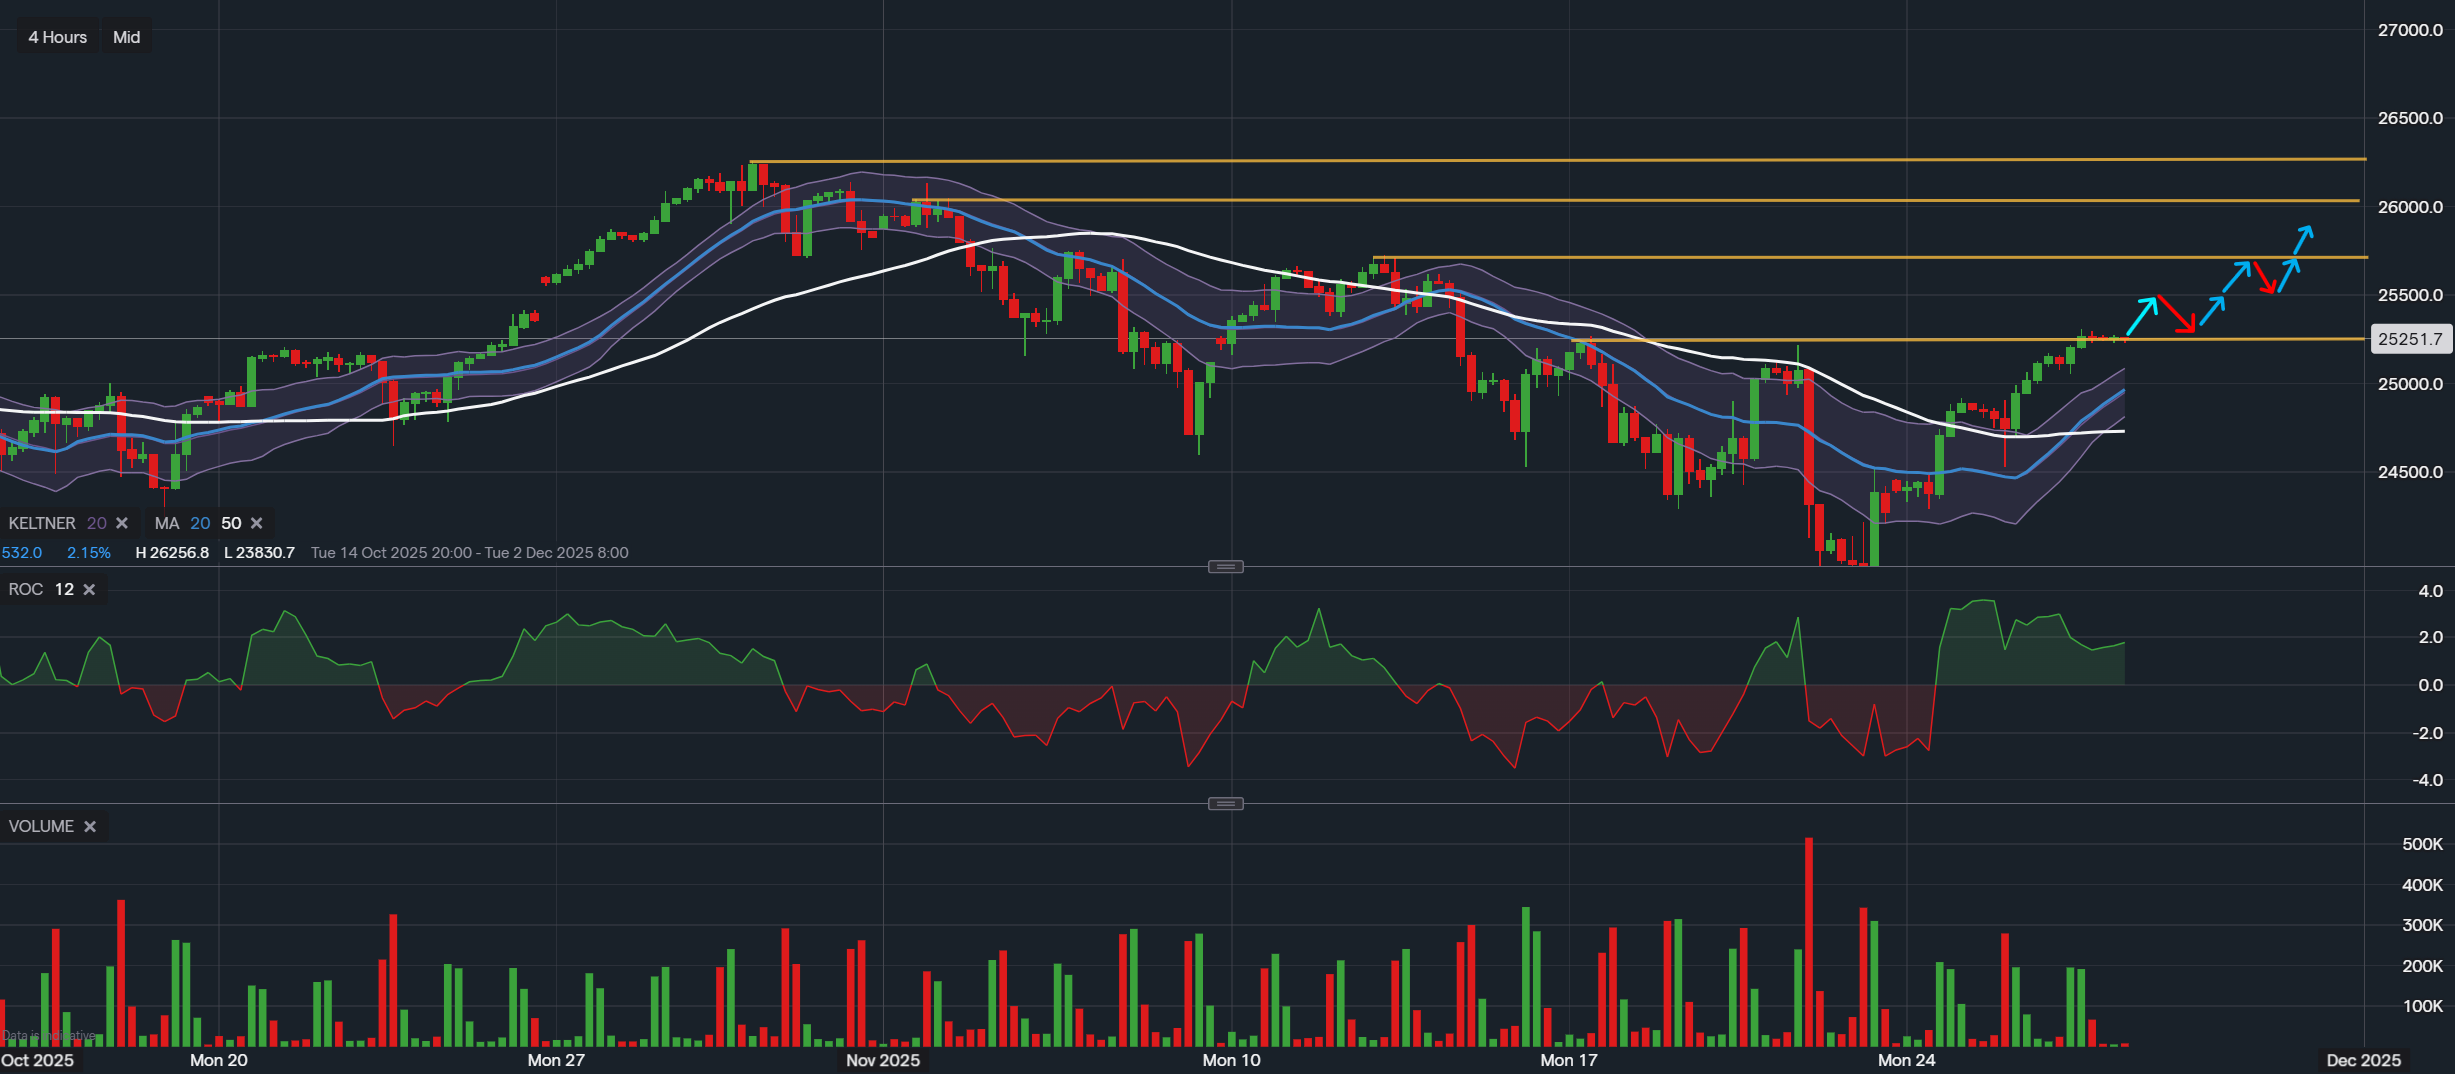
Nasdaq Market Overview:
The Nasdaq Composite enters the Thanksgiving holiday on a positive footing, with markets closed on Thursday, 27 November 2025. The most recent session on Wednesday saw the index finish 0.82% higher, continuing a pattern of strength driven largely by big-cap technology stocks. Sentiment has been supported by rising expectations of a potential Federal Reserve rate cut in December, easing concerns surrounding a possible AI-driven bubble, and a notable lift from Alphabet’s latest advance. This combination of improved confidence, softer macro fears, and sector-specific resilience has provided the Nasdaq with a firm foundation heading into the final stretch of November.
Despite the closure, the broader technical structure on the 4-hour timeframe remains active and informative. The recent upswing has allowed the index to recover from earlier losses, and the chart now reveals a battle between renewed bullish momentum and overhead resistance levels that could shape the next directional move once trading resumes.
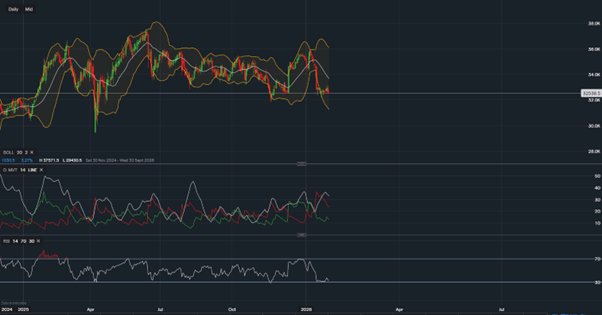
Keltner Channel Analysis: Testing Upper Band Strength
The Nasdaq’s latest advance has carried price action into the upper region of the Keltner Channel, signalling building upside momentum but also highlighting a zone where short-term exhaustion can occur. The index is comfortably trading above both the mid-line and the lower band, confirming that the recovery phase remains intact.
The Keltner structure appears to be widening slightly, a development often associated with increasing volatility following a strong directional push. If the index sustains its position near the upper band during the next session, it may suggest that buyers still have control and could target the next resistance area around the mid-25,000s. Conversely, any pullback toward the channel’s mid-line could indicate that the market is seeking a more balanced price after the recent rally, particularly as the chart shows multiple horizontal resistance layers overhead.
Rate of Change (ROC): Momentum Returning After Prolonged Weakness
The Rate of Change indicator continues to show improvement as it transitions deeper into positive territory. This shift reflects a meaningful pick-up in buying pressure after an extended period of negative momentum earlier in November. The ROC’s upward slope suggests that bullish sentiment remains active and may support further recovery attempts, provided the index does not encounter sharp profit-taking near the highlighted resistance zones.
However, the ROC has not yet reached levels typically associated with overextension, which may indicate that the move still has room to develop. Should momentum flatten or begin to taper, it may signal the early stages of consolidation something that aligns with the price behaviour seen near multi-week resistance. Traders often monitor this indicator closely during holiday periods, as lower market participation can cause volatility in momentum readings once trading resumes.
Volume Profile: Strength Visible but Not Overheated
Volume readings leading into the holiday showed a healthy increase during the recovery phase, supporting the recent upswing without signalling excess or instability. While not dramatic, the consistency of green volume bars during the rebound is a constructive sign, suggesting that participation remained relatively firm despite the seasonal slowdown.
The absence of abnormal spikes indicates that the rally has not yet been driven by panic buying or capitulation. Instead, it appears to reflect a measured return of confidence following improved macro expectations and renewed enthusiasm in major technology names. When markets reopen, traders will look for either a continuation of this steady participation or a noticeable volume expansion that often accompanies a breakout through significant resistance.
Conclusion
The Nasdaq enters the post-holiday period at a critical juncture, pressing against resistance levels that have capped previous attempts to move higher. The combination of resilience near the upper Keltner band, strengthening ROC momentum, and constructive volume patterns paints a picture of a market with potential to continue its recovery yet one that must still overcome notable technical hurdles to shift into a more decisive bullish phase.
Potential upside opportunities could emerge if buyers maintain momentum and push the index beyond the 25,500–26,000 region. Should the market fail to break through these levels, a pullback toward the Keltner mid-line or a mild consolidation phase may unfold.
Disclaimer
This analysis is for informational purposes only and should not be considered financial advice. Investors and traders should conduct their own research and consider individual risk tolerance before making any investment decisions.

Tradable assets:
Min.Deposit:
Max Leverage:
FCA:

Rating:


 Earnings Calendar
  Economic Calendar
  VAT Calculator
  Tax Free Childcare Calculator
 Percentage Calculator
 Compound Interest Calculator
  Loan Overpayment Calculator
 Mortgage Calculator
 Credit Card Calculator