Visa (NYSE: V) Stock Analysis: Can Strong Earnings Growth Offset a Bearish Technical Trend?
$317.29
04 Mar 2026, 16:45
Neutral

Join Minipip Academy and access free courses in investing, trading, economics, and more.
Sign Up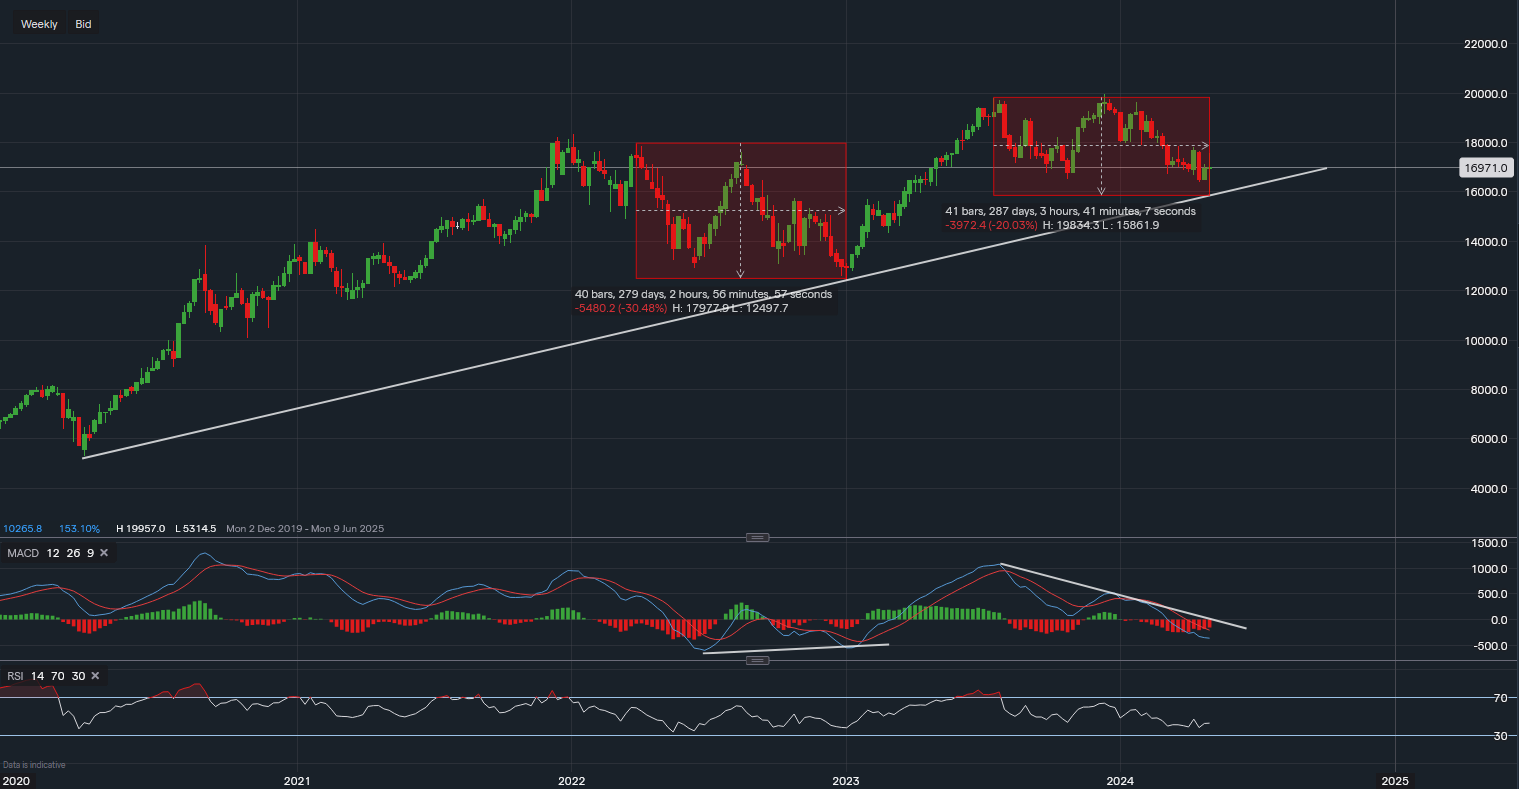
Chart & Data from IG
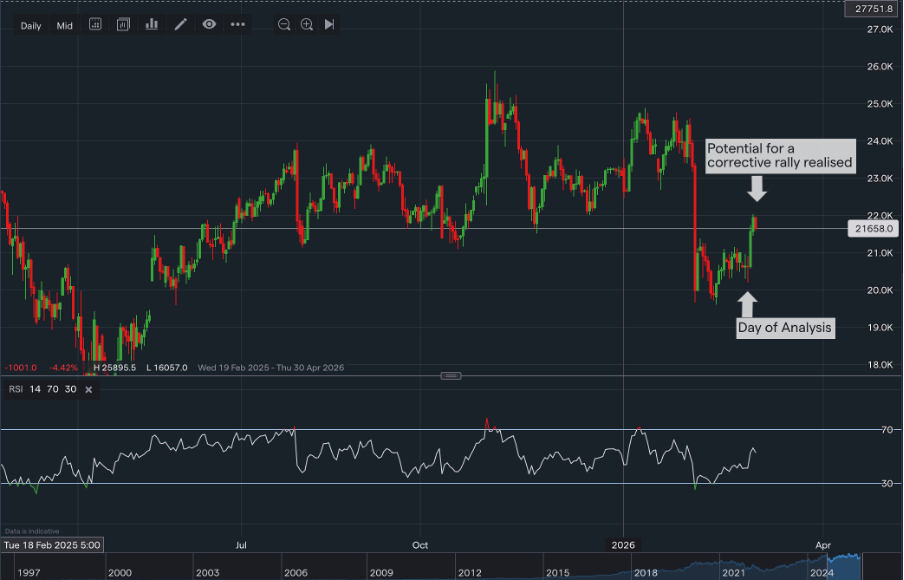
Taking a look at Apple as it is the second to last of the Big Tech to report earnings. With Nvidia only left to go after tomorrow. Currently, its share price sits around $169.71 in the pre-market trade. Based on the weekly chart, we can see that Apple is kind of forming a similar pattern to the one back in 2022. Back in 2022, the stock fell 30% peak to trough before an incredible rally of 62% in 2023. So far this year, its share price is down almost 15% compared to the 5% gain so far in the SP500. We can see that it is approaching a key support along the trendline which dates back to March 2020 (covid low). If it reaches the trendline then this area of support will demonstrate some strength before any future price movement occurs, for sure. The support along the trendline reads $158.34, a break below would almost certainly create an increased risk for a decline lower towards $140-$145. However, there are two factors to take away from here for the near-term. Firstly, just because the stock fell 30% it does not mean a similar size of fall is to occur. Valuations have changed since then and all falls are now more relative to the size of the stock and its share price. Secondly, the technical indicators are looking a little oversold now. The MACD is nearing the levels of 2022 and the RSI is now floating around those levels. Looking at the MACD, we can see that in 2022 a bullish divergence was formed, whereas so far in 2024, a bearish divergence was formed. This has contributed to this sell-off from a technical aspect. What could be a key catalyst here for Apple is if the MACD approaches the bearish divergence trendline, a break above could suggest a new bottom for the stock in the longer-term outlook. A likely scenario here may be that the earnings lead to a further sell-off in the near term, perhaps to test the trendline support. Then a new bottom formed with a set-up for a rally higher. Though this would have to be analysed after the earnings.

Tradable assets:
Min.Deposit:
Max Leverage:
FCA:

Rating:


 Earnings Calendar
  Economic Calendar
  VAT Calculator
  Tax Free Childcare Calculator
 Percentage Calculator
 Compound Interest Calculator
  Loan Overpayment Calculator
 Mortgage Calculator
 Credit Card Calculator
 Investing
  Economics
 Trading
  Technical Analysis
  Personal Finance
 Calculator